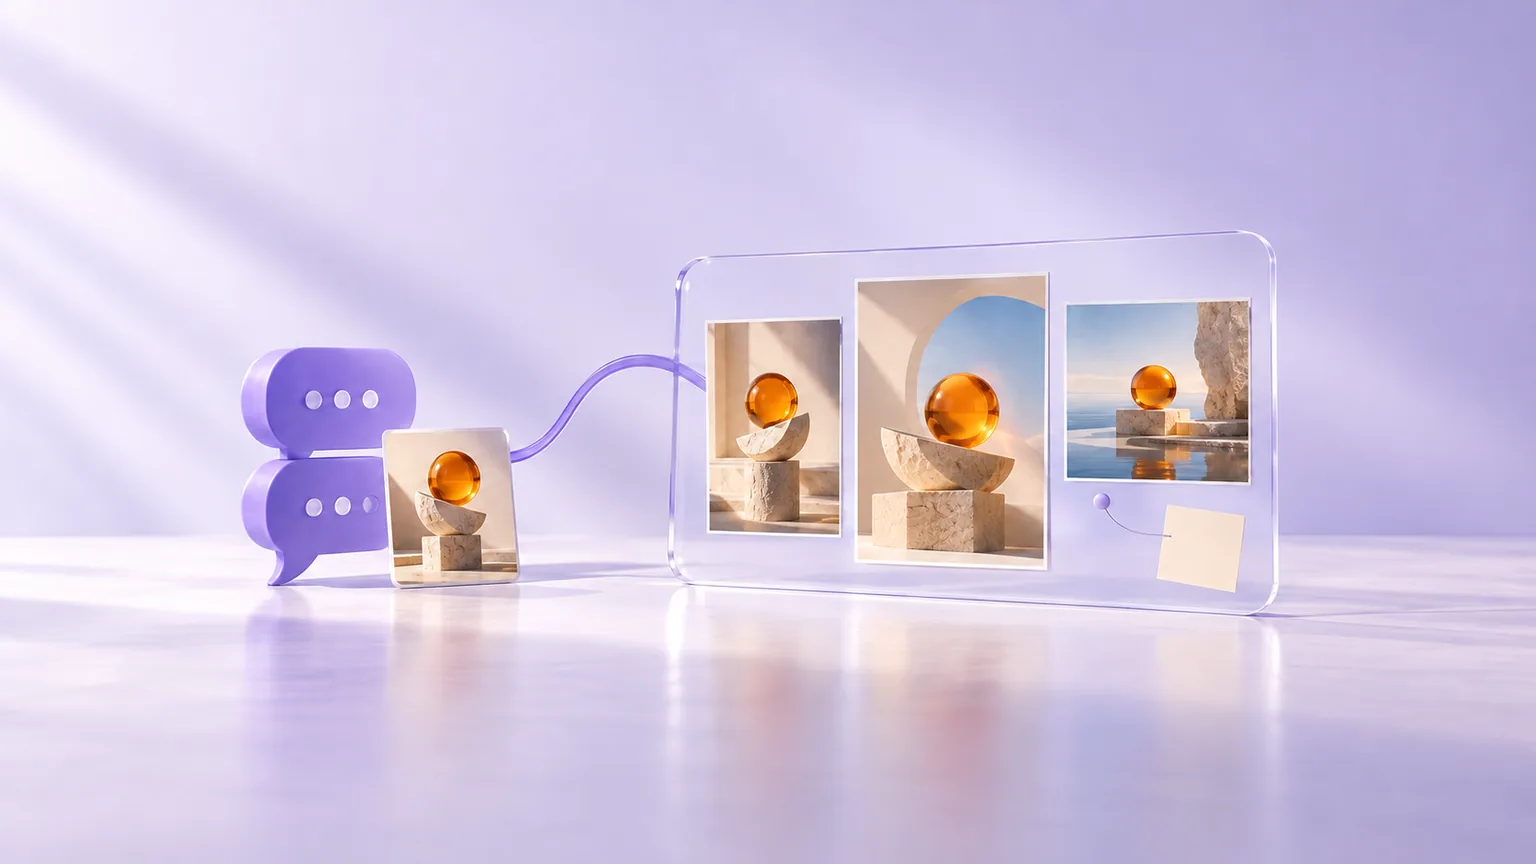
1. Supply the article and one reader question
Open the creative assistant and paste your own article or material you have permission to reuse. Include its title, source URL when available, date and intended audience. For a public URL, ask the assistant to confirm which passages it could read; paste the relevant text if access fails.
Choose one question, such as ‘What must a customer prepare before a product-photo session?’ A long report may need several visuals. The infographic tool guide explains the available output; this walkthrough concentrates on a single factual process.
2. Build a source map before drawing
Ask for a table with the proposed label, supporting passage and anything that must stay attached to it. For example, this invented practice brief says: photograph one product from the front and side; record its dimensions in centimetres; approve the scene before generating alternatives.
| Proposed module | Source detail to preserve | What must not be added |
|---|---|---|
| Photograph the product | Front and side views | A promise that two photos guarantee fidelity |
| Record dimensions | Values and cm unit | Guessed measurements |
| Approve the scene | Approval precedes alternatives | An invented success rate |
For real data, retain the period, population, unit and uncertainty. A missing value stays missing. Only combine figures when their definitions match.
3. Request a three-module visual
Replace the practice brief with your approved source map, then copy this request. Select the image model and supported portrait ratio in the workspace.
Create one portrait infographic from this approved practice brief.
Audience: a small shop preparing product photographs.
Title: Prepare your product-photo brief.
Use exactly three modules in this order:
1. Photograph the product — Front and side views.
2. Record dimensions — Write each measurement in cm.
3. Approve the scene — Confirm the direction before alternatives.
Use a cream background, dark text, restrained purple accents and simple supporting icons. Give each module generous space.
Use the exact wording above. Do not invent statistics, dimensions, sources or extra steps. Do not turn the numbered steps into a chart.
Generate one image, not a collage of variations. Use my selected image settings.
An image can still misspell these labels. If exact typography matters, request a background without lettering and add the approved copy as separate text layers in the image editor. See the editable-poster guide for that workflow.
4. Correct one factual defect
Compare the actual output with the source map. Name the defect precisely instead of asking for a generally ‘better’ infographic.
Correct module 2 only. Its approved text is:
Record dimensions
Write each measurement in cm.
The current result omitted the unit. Restore this exact copy.
Keep the other two modules, title, order and visual direction unchanged.
If this is a flat image, explain that regeneration may change nearby pixels. If it is an editable project, modify only the relevant text layer.
Save the approved version first. A preservation instruction is not a pixel lock; inspect neighbouring labels after a regenerated correction.
5. Check meaning at full size and reading size
Check every word, number and unit against the article at full resolution. Then view the infographic at the width your reader will see. Can the title and all three labels be read without zooming? Do arrows imply the right order? Is an optional action presented as compulsory?
Place the source title, date and URL in readable accompanying text, or typeset a source footer yourself. Keep the approved copy separately so the information remains available as text. For proportional statistical charts, use a data-chart workflow and verify its values; generated bar lengths are not reliable measurements.
6. Keep a usable file and a next step
Can I use a PDF? Provide the relevant readable text or a supported document attachment, then check what the assistant extracted. A scanned or inaccessible page must not be treated as successfully read.
Is the result editable? A generated PNG or JPEG is flat. Keep the native .sparkles project if you used text layers; putting a flat image in a slide does not recover those layers.
Does this cost Credits? Assistant work and requested image generation follow the existing pricing. Manual text changes do not submit a new image-generation job.
To explain the same material one point at a time, use the blog-to-carousel guide. To let readers work through actions, try an interactive checklist.
Sources and further reading
Paste a prompt from this guide and adapt it to your material. Assistant work and image generation use the applicable Credits.